Never again be hunted by whales and big players!
This indicator combines both technical and on-chain analysis, and it shows next moves of the biggest players on the market, directly on the chart.
This indicator combines both technical and on-chain analysis, and it shows next moves of the biggest players on the market, directly on the chart.
...everyone still trades on the same principle. This is why most traders don't make consistent profits.
But from now, there is a tool, with which you can see exactly what the move will be taken by the biggest players in the market, who trade with 100+ million even billions of dollars.
By following their movements, just as whale cubs follow their mother, you can profit together with them.
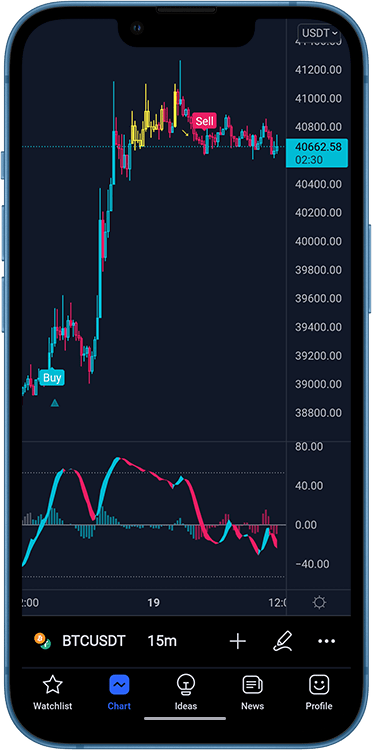
Combining technical analysis and all other parameters from the indicator, you can find, buy and sell signals on the chart that predicts future market movements.
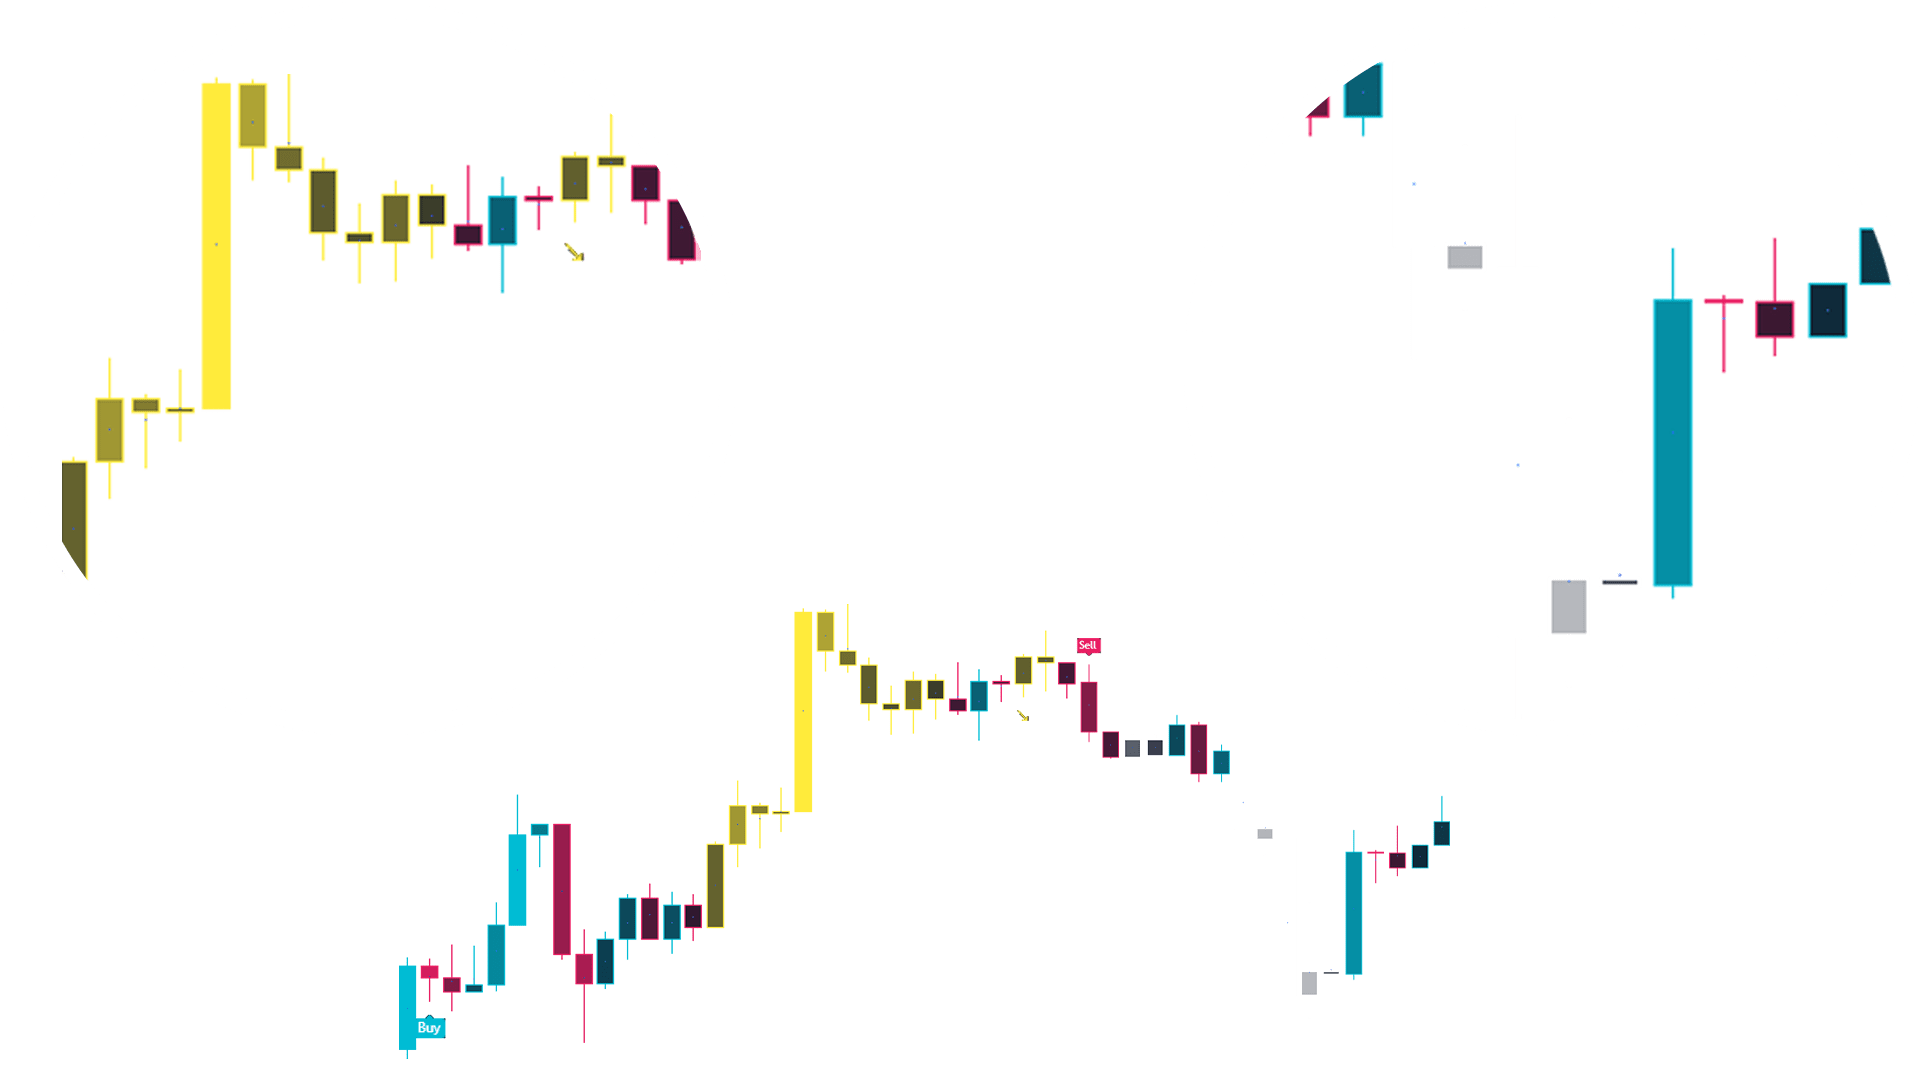
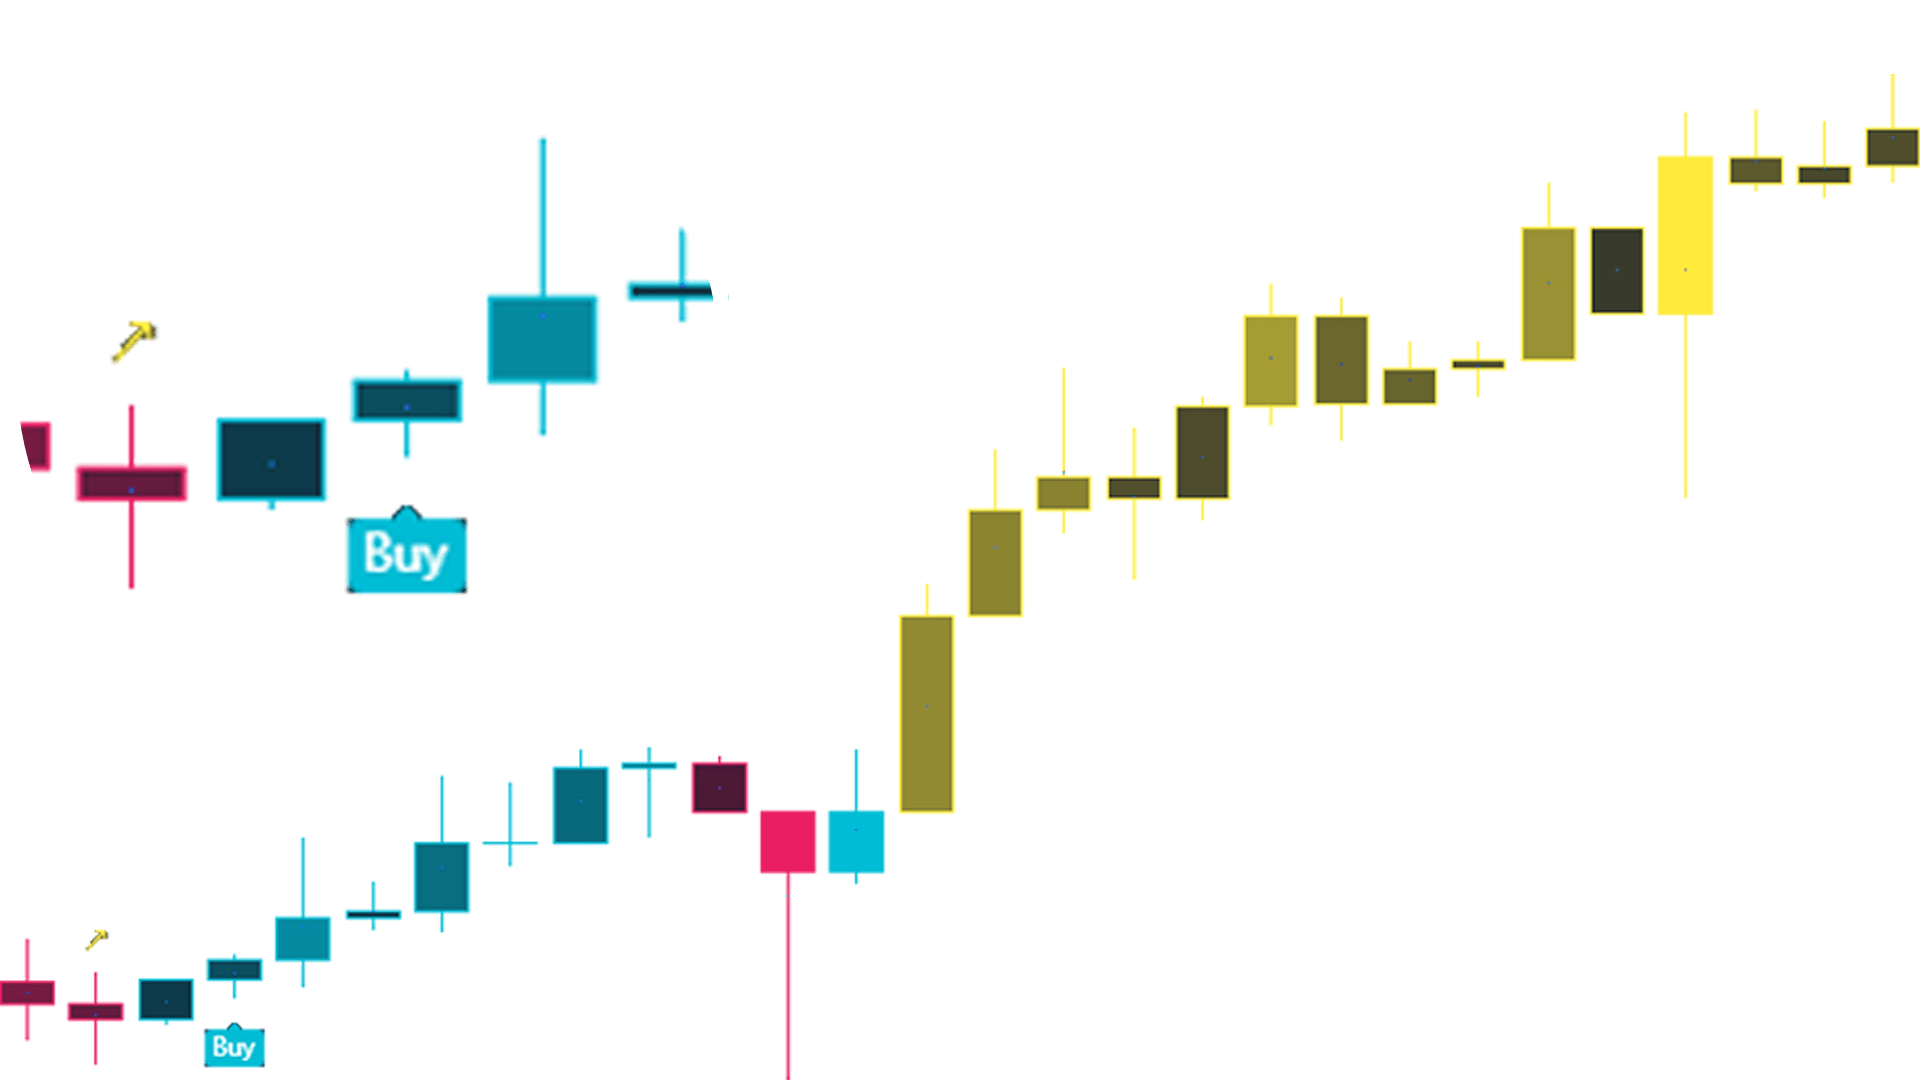
The candles on the chart can change color to yellow (bull) or white (bear), depending on which of the biggest whales are manipulating the direction of the market currently.
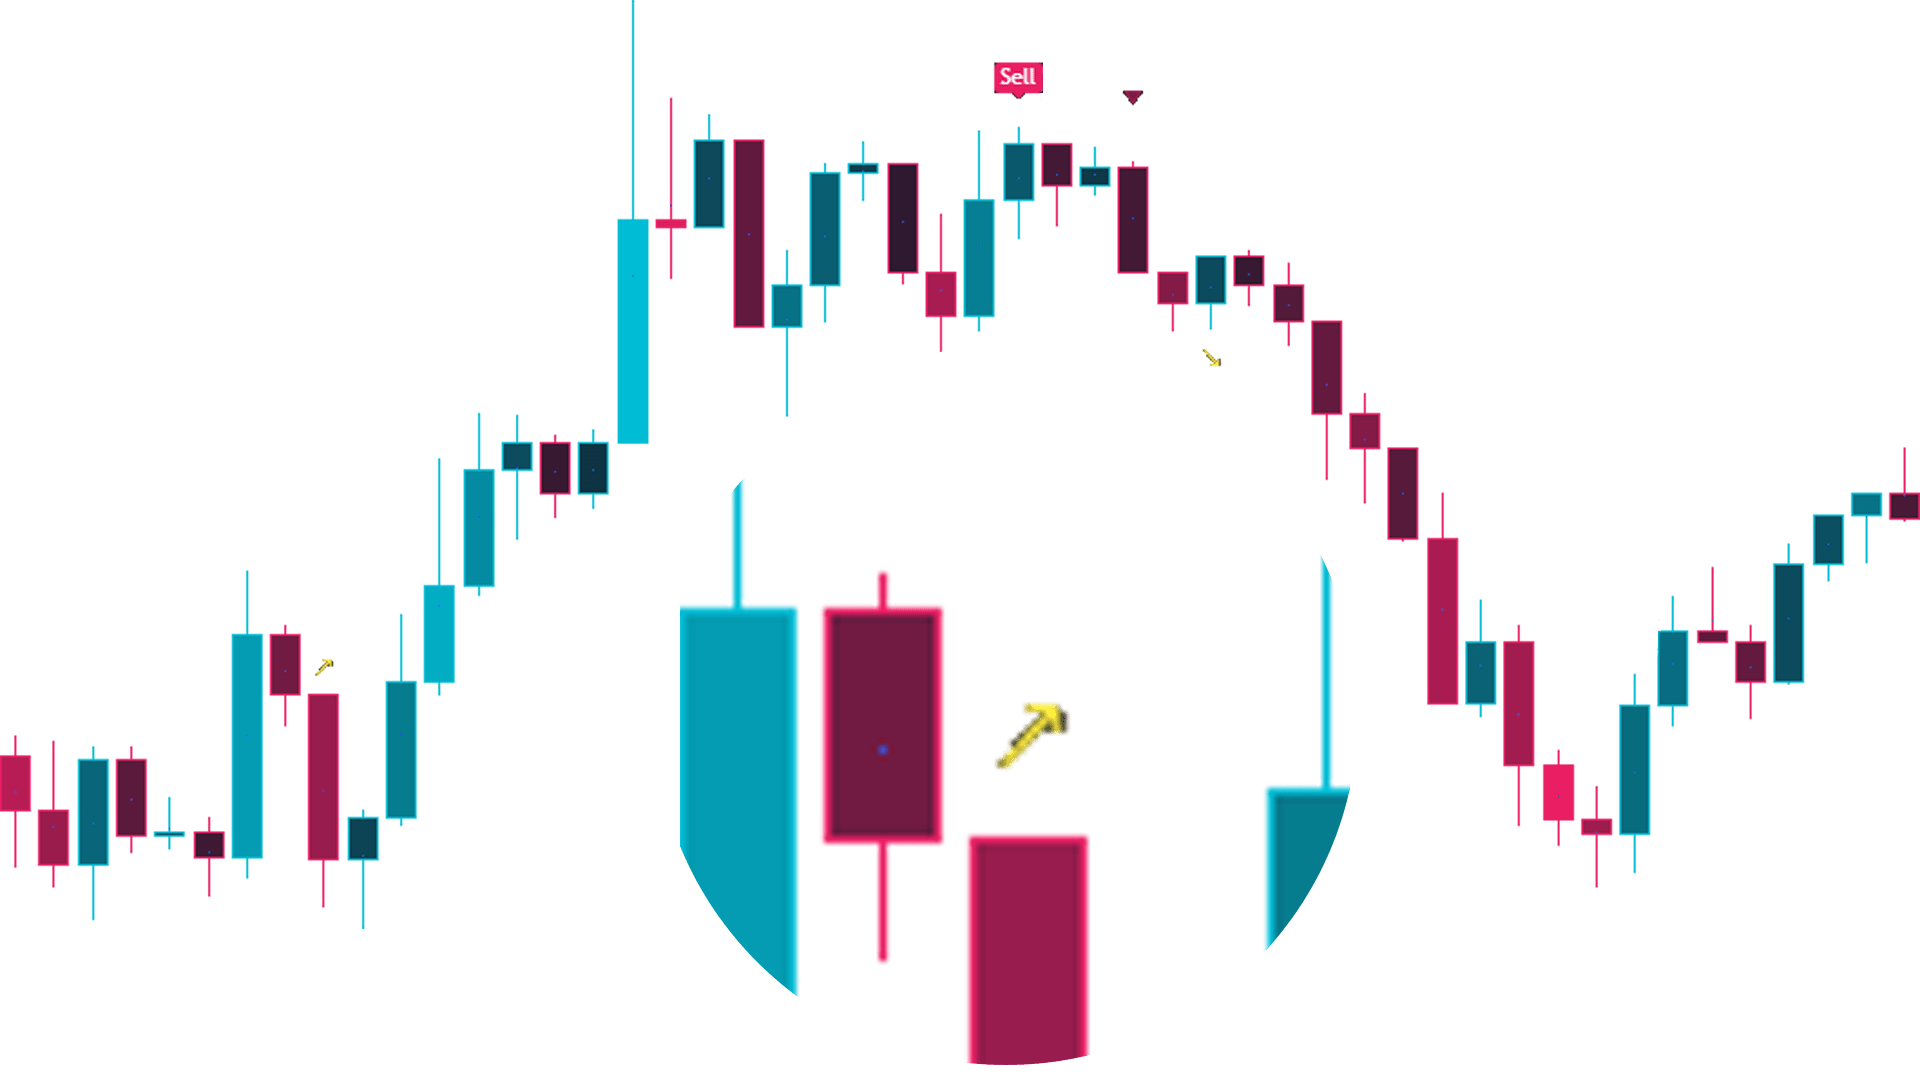
Order blocks on the chart are attached in the form of an arrow pointing up or down. In the background, this means that the market is currently moving in the direction of the order block, but it should return to that level in the future to pick up liquidity at those levels.
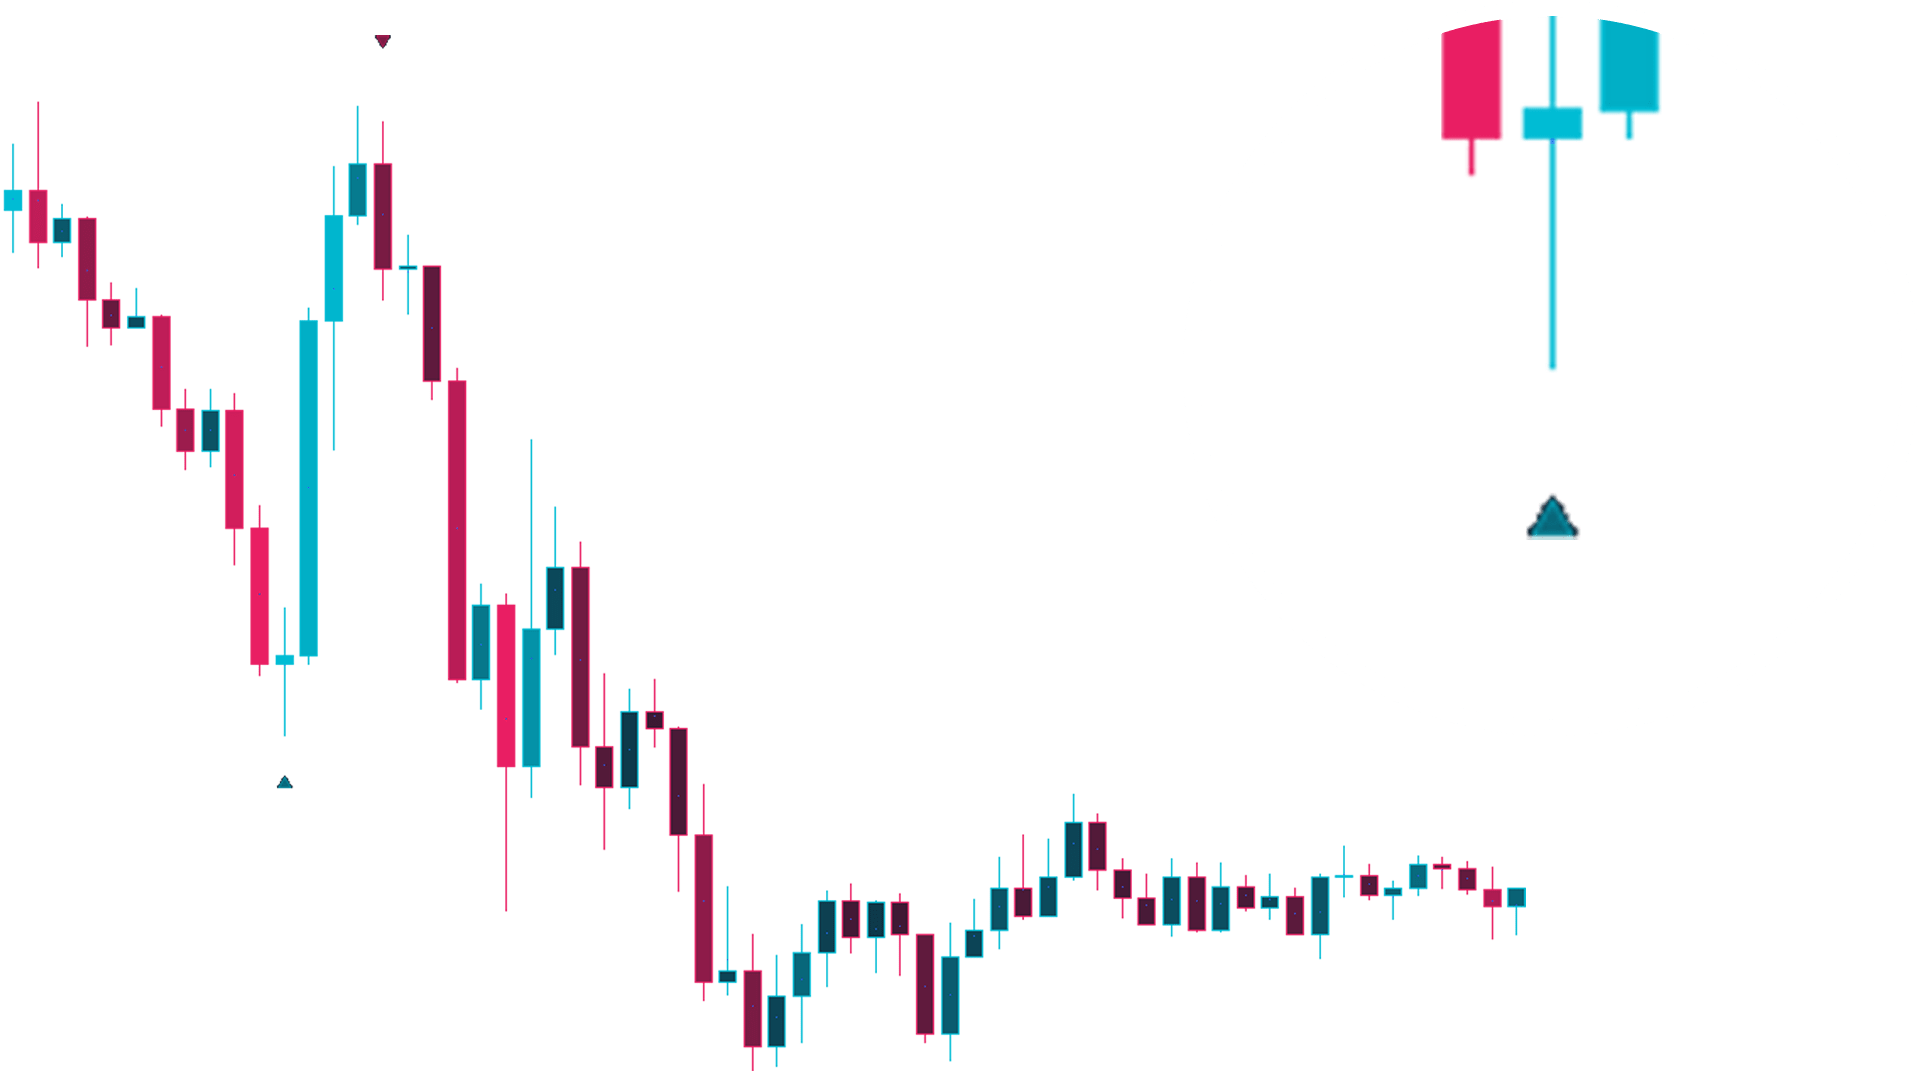
This simple arrow shows the direction in which the market is currently moving. You can also use it to conclude when the market has changed the trend and open or close positions based on that.
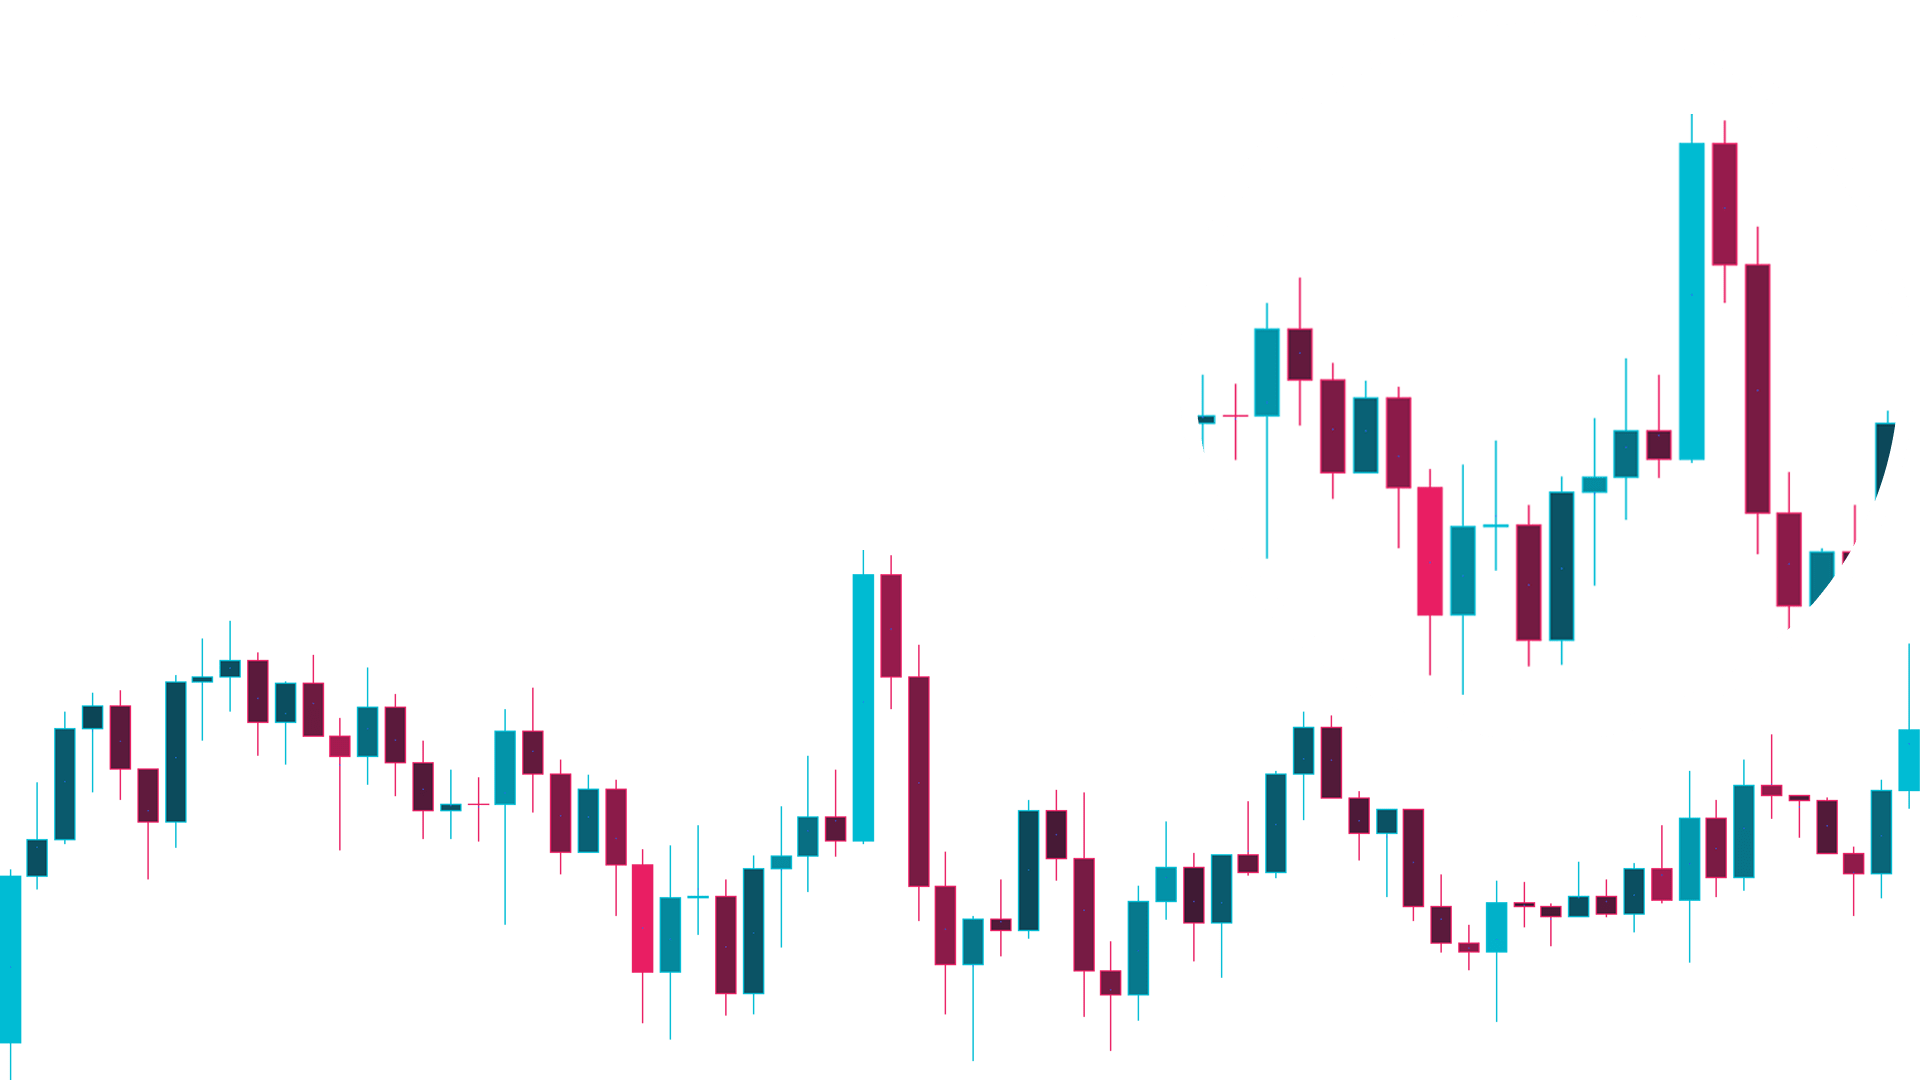
The candles on the chart are shown by transparency based on the volume below it. In addition to a cleaner chart, you can also clearly see how much power the current market direction has.
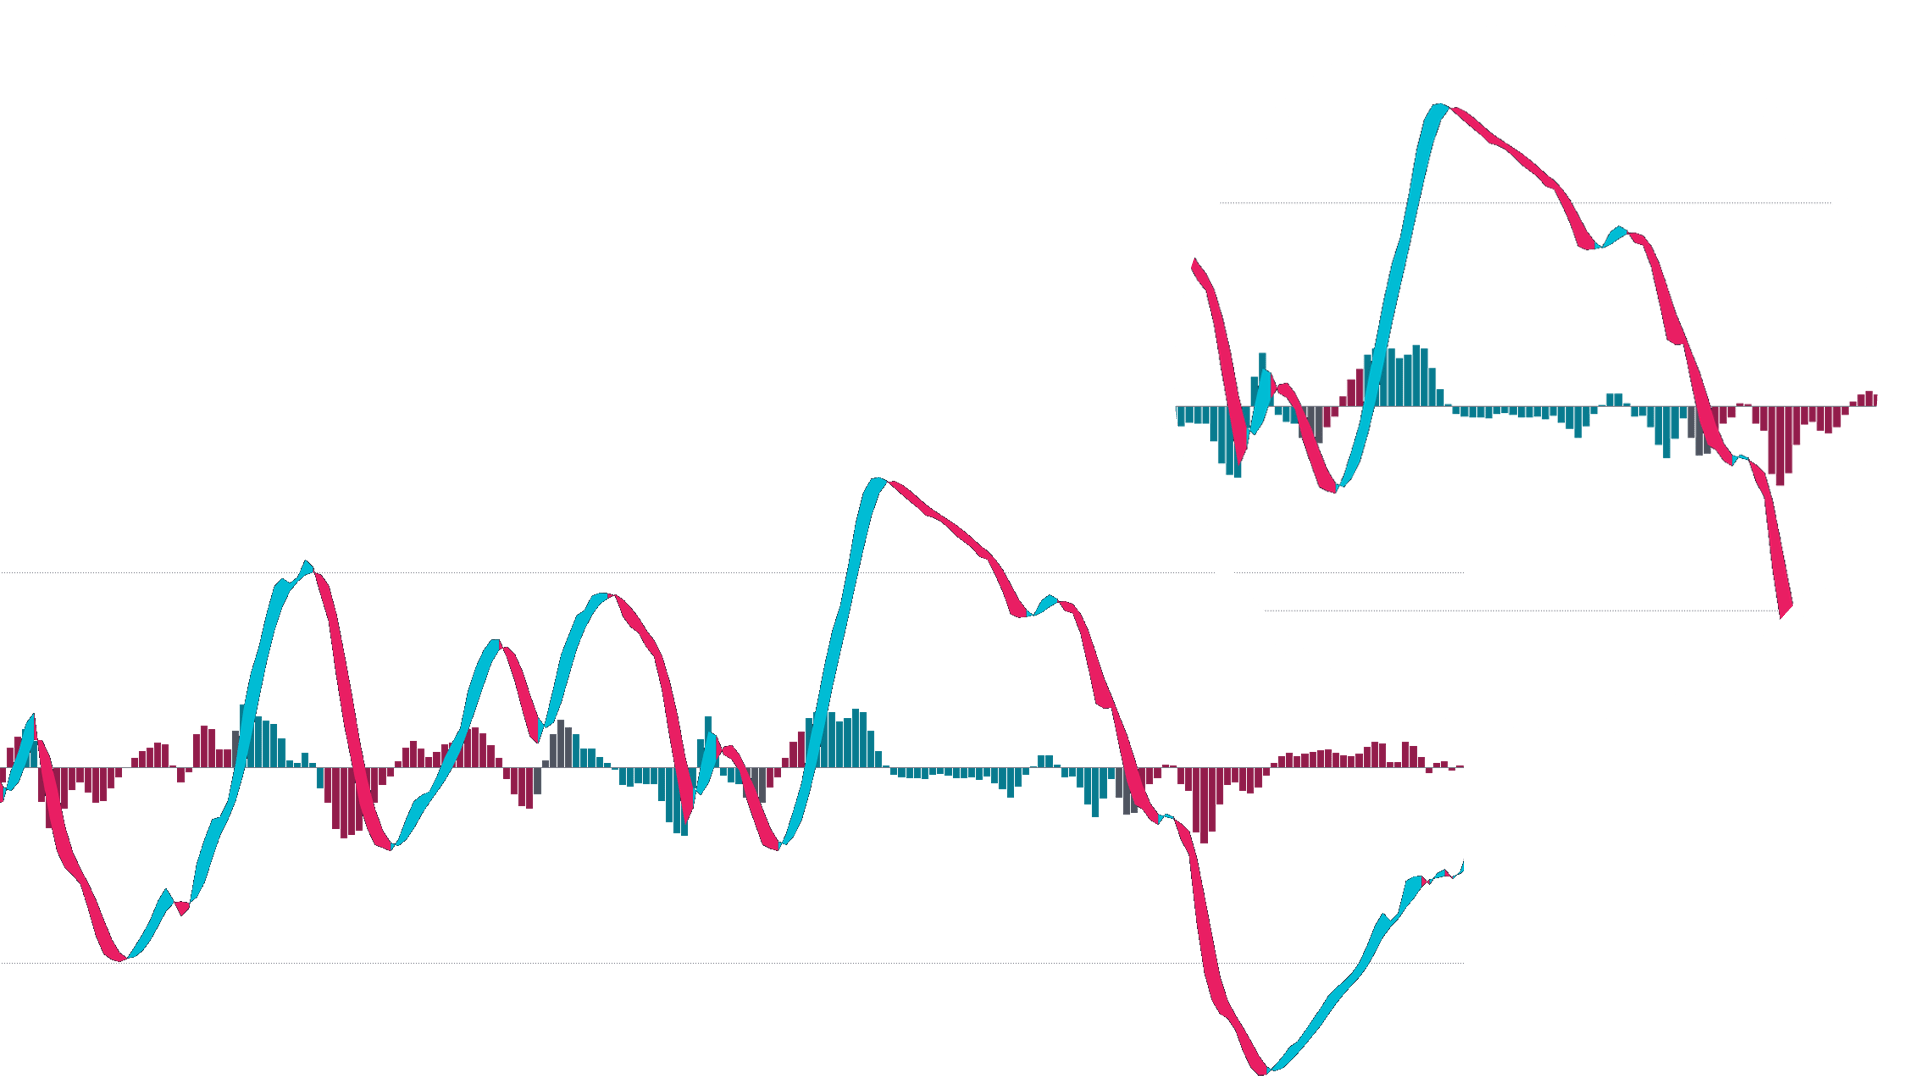
On the wave, the second part of the indicator below the chart, you can clearly see how much space there is for a dump or a pump, and in which force the market is moving.
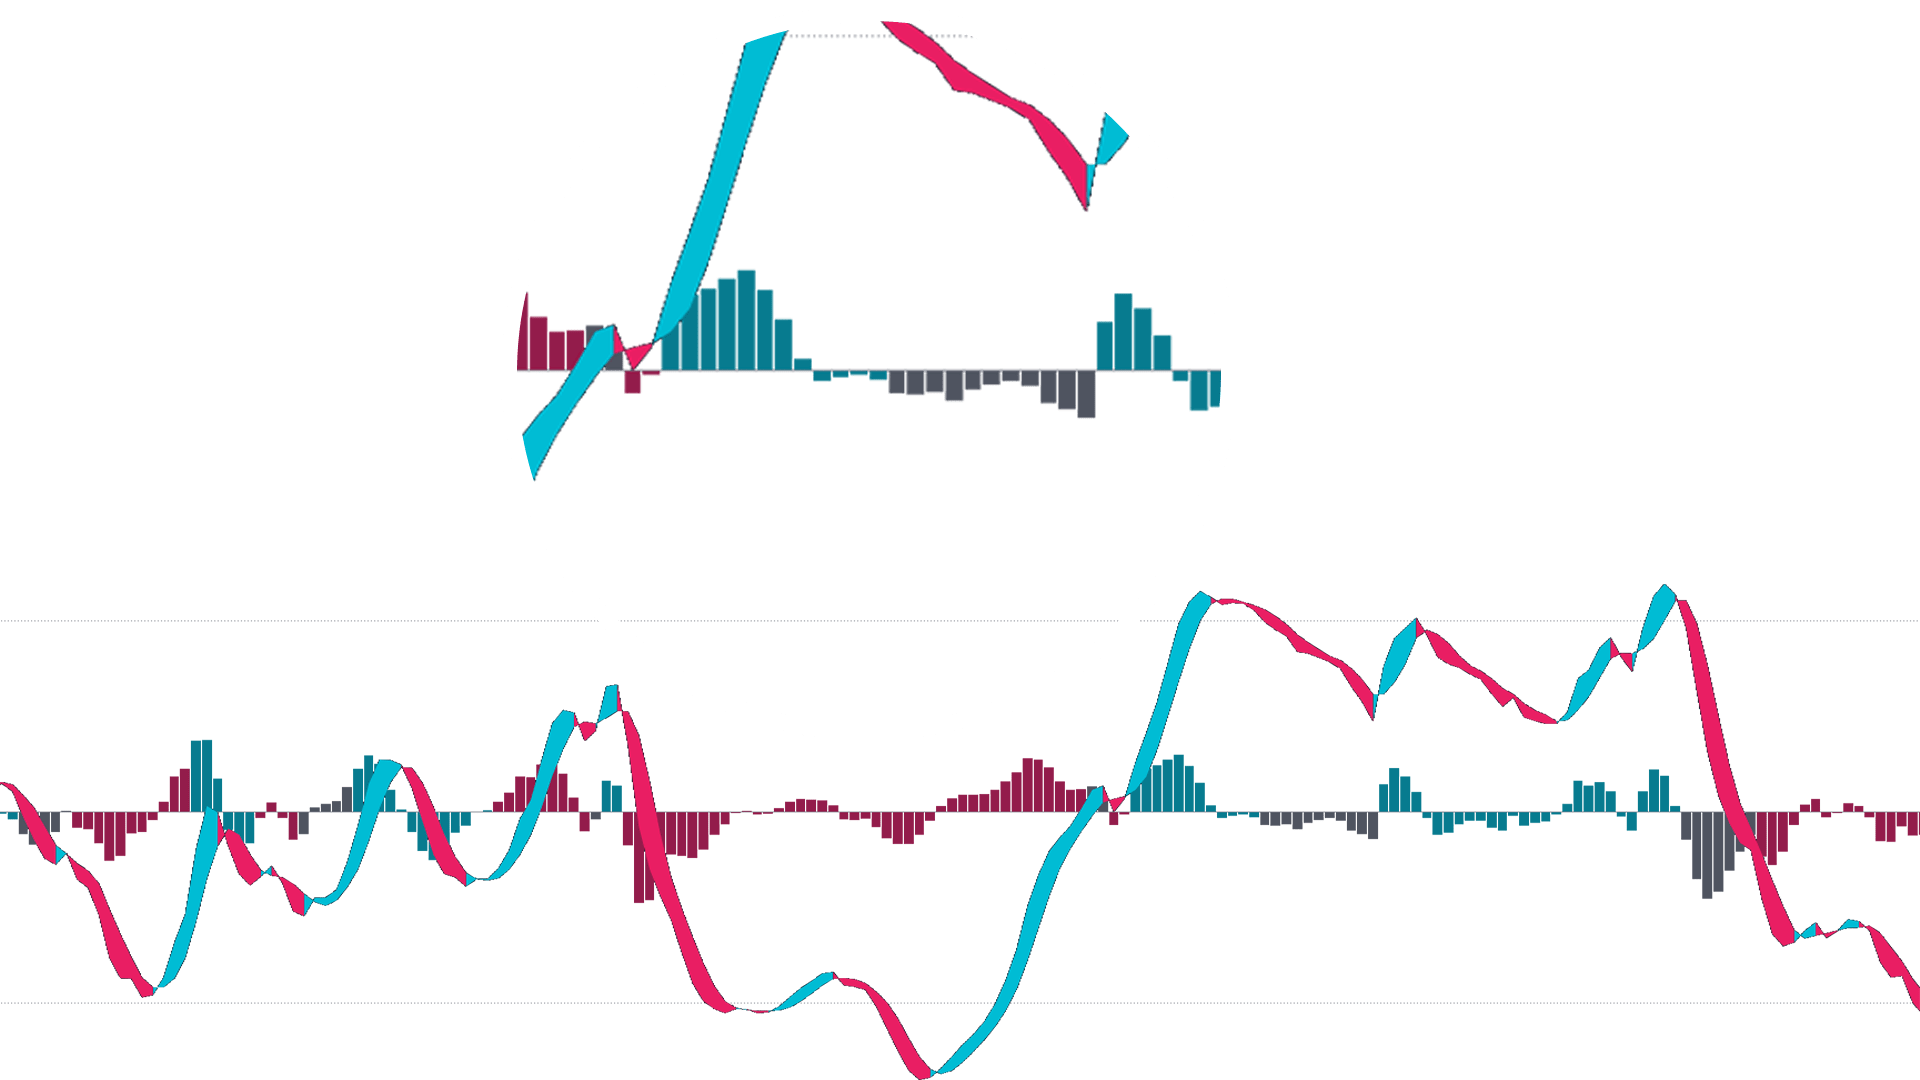
In the zones where the market consolidates (gray color), it is not encouraged to enter the positions because it is much harder to assume the next movement of the market, also you can easily see when the market is in the bull or bear trend.
I'm sure you'll love it!
Definitely yes. You can certainly use this indicator if you are new to trading with ease. You can use our beginner's guide to start off on the right foot as a beginner.
Based on previous clients' experiences, this indicator significantly increases the chance of seeing good buying and selling opportunities, but there is no magic formula to guarantee accurate market predictions.
No. For one subscription price, you can have everything listed in the offer. Also, it is compatible with the free TradingView plan, and you can use it without paying an additional plan for it.
The indicator is optimized mostly for crypto trading, but it can be used on any market, including stocks, indices, forex, futures, commodities... across all timeframes. Our indicators are fully customizable and can be used for any style of trading.
The message's average response time is 2 minutes!
$24.99USD/mo
$59.99USD/mo
$128.99USD/mo

I struggled to break even for a long time, until I found out about this indicator. Now I can see and understand exactly what is happening in the depths of the crypto market and on that basis now I can bring the right decision that can bring profit.
Justin HurlbuttOver 106+ million people trade cryptocurrencies, only 5% earning more than $1,000 a year.
Lots of manipulation, volatility, pumps & dumps... it happens every day.
Most traders have two major challenges with growing their wealth:
That's why we make this indicator - to give small investors the right information to grow their wealth.
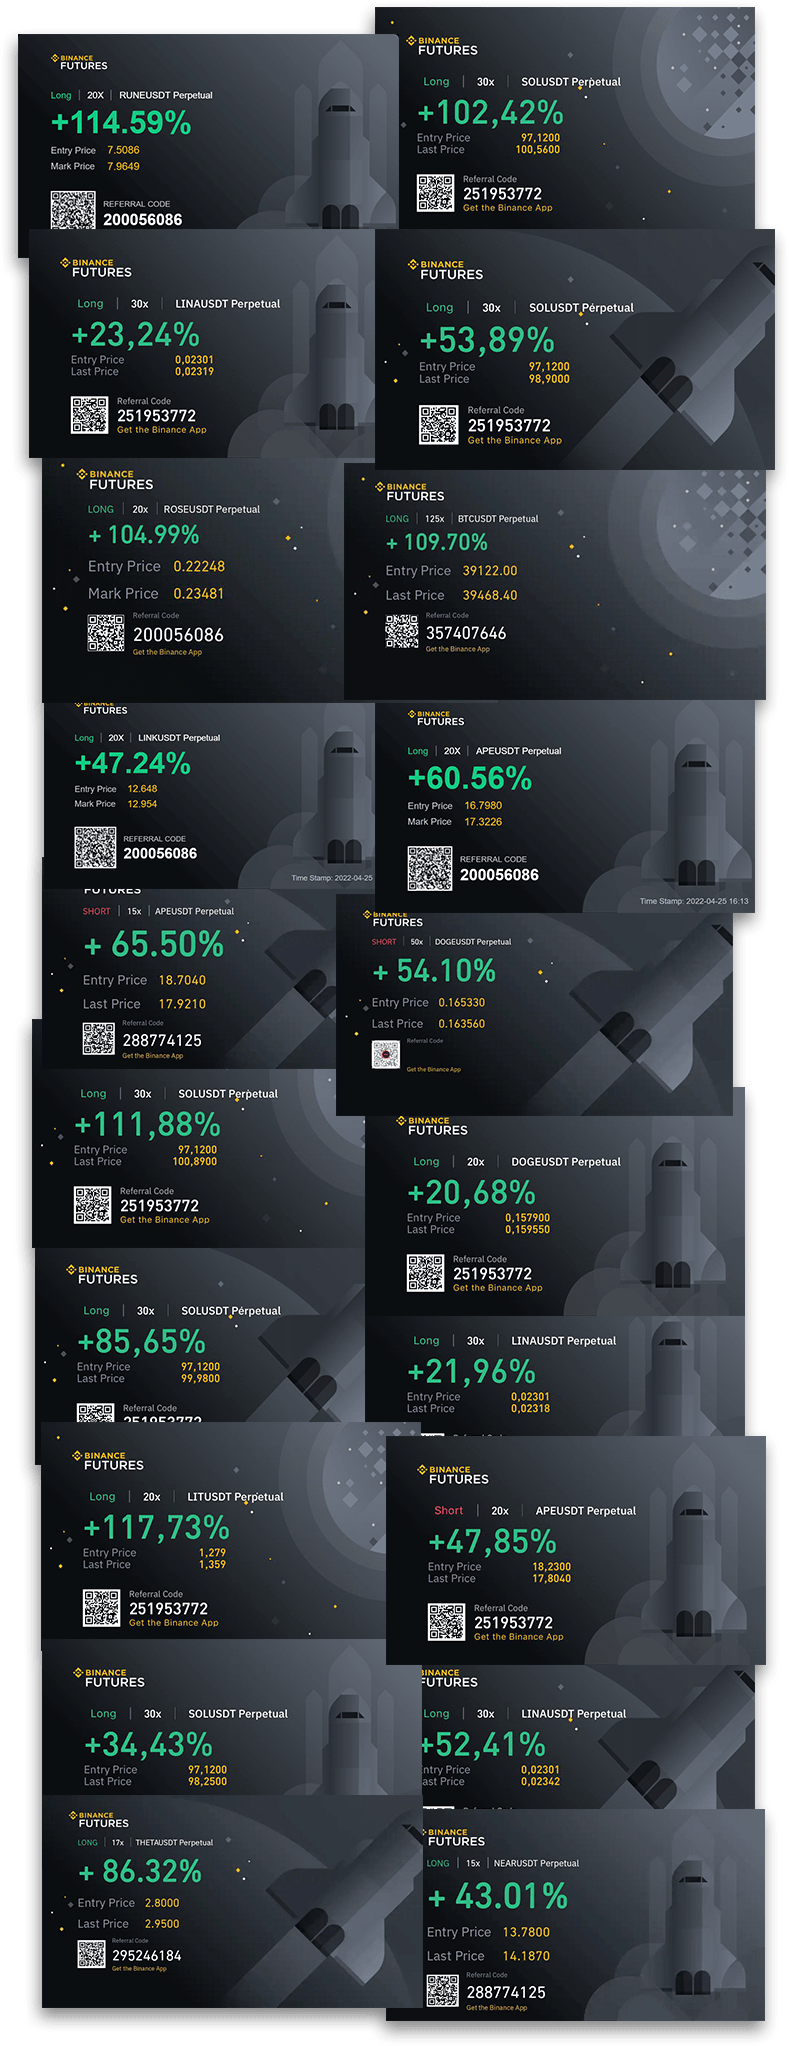
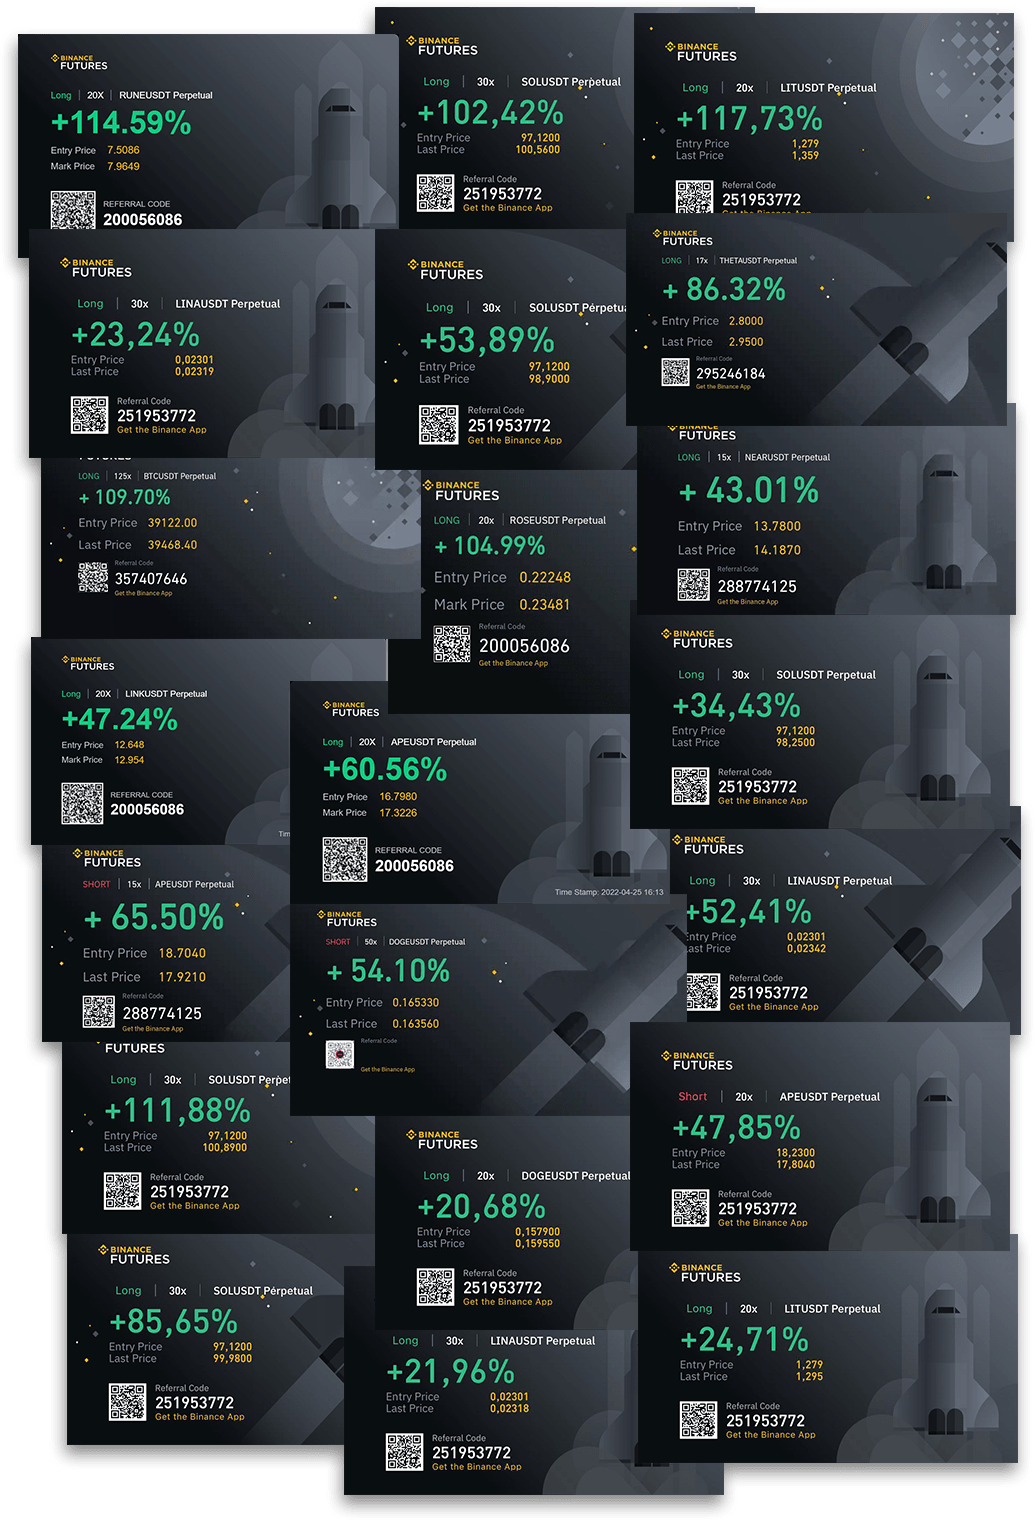
In the last 3 months, we helped over 2500 small traders (Like you) to beat the market and generate over $2 million by trading crypto. I'd love to give it a try.

Founders of indicator & crypto traders
For all questions, contact us at info@webhookser.com